Note: This wealth rule uses trailing data. Trailing data produces the long-term trends for your company. It looks at a year’s worth of numbers a month at a time.
For example, if you want to determine trailing revenue for January 2021, add the revenue from February 2020 through January 2021 and divide that result by 12.
If you want trailing to determine revenue for February 2021, add the revenue from March 2020 through February 2021 and divide that result by 12.
Looking at the January and February 2021 trailing data points gives you a trend. Is the graph increasing or decreasing? If it is increasing then sales are increasing on a long-term basis.
For inventory days, if the trailing data is increasing you are adding inventory. Find out why. Inventory days should be steady or decreasing.
Trailing data can be calculated for any metric you wish to track.
This wealth rule and the next two, track trailing current ratio, inventory days, receivable days and debt ratios.
The graphs show the trends of each metric and will be explained in the appropriate wealth rule.
Now onto Wealth Rule No. 8.

Inventory is a bet (yes, I’ve written these words before). Inventory tracking is key to a sound cash policy. You don’t want to spend cash you don’t need to spend. The best ways to track inventory is to make sure it changes monthly on your balance sheet and monitor inventory days.
If your company does not have inventory, then you do not calculate the ratios described below.
Inventory days is the number of days between the time a part is purchased to the time it is used to create a product or provide a service. Inventory turns are calculated on annualized costs.
Calculate this ratio by using both the profit and loss statement and the balance sheet:
Annualized Cost of Goods Sold
Inventory
Then the inventory days calculation is:
365
Turns
For those of you who have studied inventory days in a classroom, you’ll notice that I use cost of goods sold rather than material expense to calculate this ratio. My reasoning is that, unlike suppliers/distributors, as contractors we cannot sell a part without installing it.
Selling a condenser fan motor means including the labor to install it and making sure the system is running properly after the installation. Part plus labor. Those are the major components of cost of goods sold and that is why I use cost of goods sold rather than material expense to calculate this ratio.
The inventory days are calculated from the inventory turns. The days trends are what you need to watch each month.

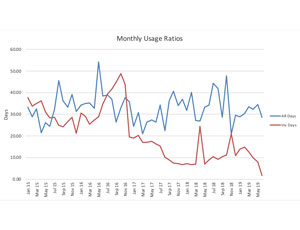
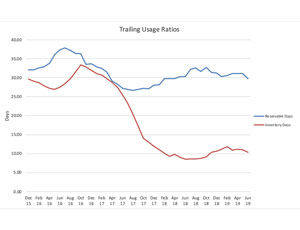
The figures below show the monthly calculations and the trailing data points for these ratios.
You can’t really tell what is happening with inventory on the monthly graph, however, the trailing data tells the story.
The trailing data graph for this client shows what happens when you don’t pay attention to inventory. Inventory days were increasing significantly which is trending the wrong way.
The company owner was not keeping track of inventory until the company got into a cash crunch. Then the owner tightened up the warehouse, hired a responsible inventory manager and started tracking inventory. Inventory then decreased significantly and remains stable now on a long-term basis which means that the company is efficiently using inventory.
Beware! An inventory increase of five days is significant because your company has an additional week of inventory. Find out why.
A sound inventory policy means tracking inventory days and making sure they are consistent.


