Find out how quickly inventory is increasing or decreasing in your business
Over the past few months I have written about liquidity ratios, debt ratios and productivity ratio. This month looks at the final ratio: Inventory Days, which tells you whether you have too much inventory or are building inventory.
The Inventory Days ratio lets you know how quickly inventory is increasing or decreasing in your business. Since inventory is a bet, it’s important to know how much of your hard earned cash is being spent on inventory. It’s defined as the number of days from the time you purchase an item to the time you use that item on a job.
The Inventory Days ratio is calculated from the Inventory Turns ratio. I don’t track turns because the critical ratio is the number of days. Inventory Turns is calculated by dividing annualized cost of goods sold by inventory. This is not the “text book” definition of inventory turns, which uses annualize material expense divided by inventory. In our industry, materials and labor are connected. You can’t install a motor or system without labor. That’s why I use cost of goods sold rather than simply material expense.
Annualized cost of goods sold is year to date cost of goods sold times 12, divided by the month of the fiscal year covered by the calculation. For example, if your fiscal year end is December 31 and you’re calculating August’s annualized cost of goods sold, take the total cost of goods sold from January through August, multiply that number by 12 and divide it by 8 (August is the 8th month of your fiscal year).
Inventory days are calculated by dividing 365 by inventory turns.


This ratio assumes you’re tracking inventory properly. If you have the same inventory number every month, then this ratio is useless. If you have no inventory on your balance sheet, this ratio is useless.
Assuming your inventory is accurate, every contractor’s inventory days should be less than 30 days.
If your inventory days are less than 30 days, you still have to be vigilant. If they’re 18 days and they jump to 23 days, that’s an extra week of inventory in your business, which is significant. Find out why — it could simply be the company received a fall or spring stocking order, It could be build up for a large commercial job or someone isn’t paying attention and ordering, rather than using, inventory in the shop.
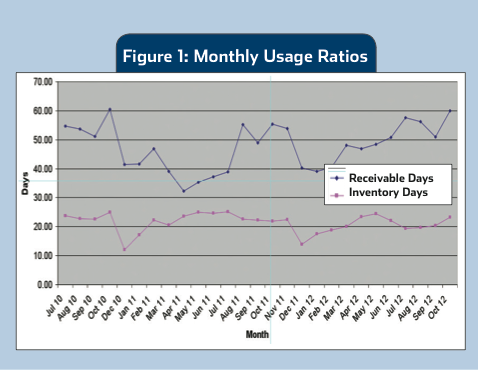
Like all of the ratios discussed previously, the trends are important. Figure 1 shows monthly Receivable Days and Inventory Days — I covered Receivable Days in the June issue.
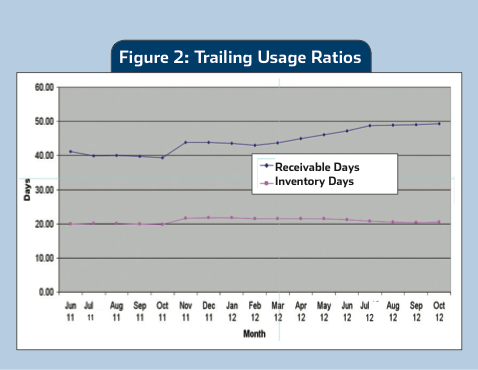
It’s hard to tell what’s happening with inventory days from this graph. Figure 2 shows trailing long-term inventory days. You can see the inventory days line is flat. This is good. It shows in busy times and slow times, inventory is at a consistent level for that time period.
You now have all 10 operational ratios. Calculate each ratio every month, plot the trends and you’ll spot minor issues and take care of them before they become major crises. You can make good business decisions based on good financial data.
 Ruth King is president of HVAC Channel?TV and holds a Class II (unrestricted) contractors license in Georgia. She has?more than 25 years of experience in the HVACR industry, working with contractors, distributors and manufacturers to help grow their companies and make them profitable. Ruth has authored two books: The Ugly Truth About Small Business and The Ugly Truth About Managing People. You can contact Ruth at ruthking@hvacchannel.tv, or call 770-729-0258.


 Ruth King is president of HVAC Channel?TV and holds a Class II (unrestricted) contractors license in Georgia. She has?more than 25 years of experience in the HVACR industry, working with contractors, distributors and manufacturers to help grow their companies and make them profitable. Ruth has authored two books: The Ugly Truth About Small Business and The Ugly Truth About Managing People. You can contact Ruth at


