By using both long- and short-term benchmarking, contractors can quickly correct potential problems.
In my past two columns, I discussed how short-term and long-term benchmarking is crucial to making great business decisions. In this column I will discuss actual contractor data and present some valuable “lessons learned” that you can take away.
Short-term benchmarking
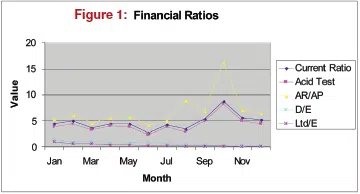
Take a look at Figure 1. This company had a minor receivables issue, which they could have easily taken care of had they used their data to spot it. Look at the yellow line (accounts receivable/accounts payable). When the accounts-receivable/ accounts-payable ratio and the receivable-days ratio increase together, warning sirens should go off. It reveals a growing collection problem that must be addressed immediately.
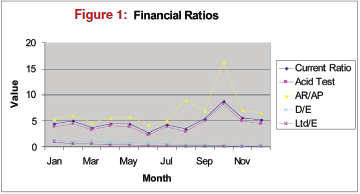
When I pointed this out to the contractor, he made a small effort to correct the issue but quickly forgot about it. (The ratio went down a little, and then immediately back up). Unfortunately, as you can see, the receivables to payables ratio grew rapidly over the next few months and spiked to the point where he had hundreds of thousands of dollars in receivables but no cash to pay his gasoline bill. This contactor finally “got religion” and has paid attention to receivable days ever since.
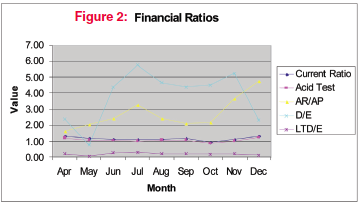
Figure 2 is typical for a contractor that installs large commercial hvacr projects over one year. The debt-to equity line (light blue) gets extremely high as the jobs start. However, notice that the long-term debt-to-equity line (purple) remains under 1. This is why I say that the debt-to-equity ratio does not matter as long as the longterm debt-to-equity ratio remains under 1 and greater than 0. As the jobs progress and get closed, the debt-to-equity ratio drops significantly while the accounts-receivable- to-accounts-payable ratio rises dramatically. The contractor must watch both of these ratios to ensure that the debt-to-equity ratio does drop as the jobs close, and the receivables-to payables-ratio does decrease as collections increase.
Long-term benchmarking
Long-term financial tracking actually predicted the slide in new construction about a year before the media did. We call this longer-term information “trailing data.”
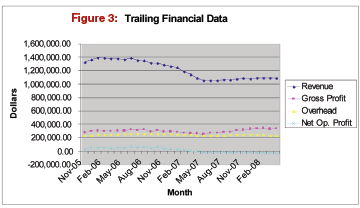
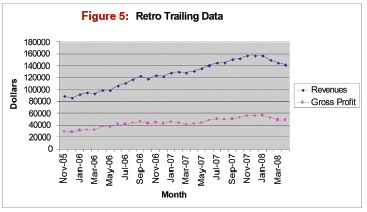
The dark-blue revenue line shows a dramatic decrease in a few months in both Figures 3 and 4. In the company represented by Figure 3, we dramatically increased their replacement business during the same time (see Figure 5) so that the overall effect was not as devastating as in the company represented by Figure 4. The dramatic growth has leveled off and has declined a little with the further changes in the economic climate. However, this company would have been out of business had it not seen the coming decline and acted to dramatically increase revenues in residential replacement.
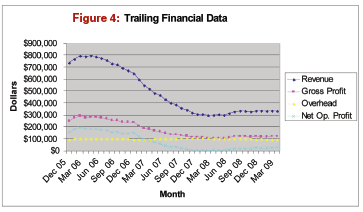
The company in Figure 4 started late in the service and replacement business and severely cut overhead and owners’ salaries to stay alive. Their business has leveled off, and the effects of the service and replacement sales can be seen in the almost straight dark blue line that is trending upward slowly.
Financial benchmarking, both short and long term, is critical to making good business decisions that will keep your company financially healthy. When you see the numbers trending in the wrong direction, take action immediately. It could save your company!
Ruth King has over 25 years of experience in the hvacr industry and has worked with contractors, distributors, and manufacturers to help grow their companies and become more profitable. She is president of HVAC Channel TV and holds a Class II (unrestricted) contractors license in Georgia. Ruth has written two books: The Ugly Truth About Small Business and The Ugly Truth About Managing People. Contact Ruth at ruthking@hvacchannel.tv or 770.729.0258.

